
A UX researcher or product manager opens a new tab, types “competitive benchmarking UX software,” and is instantly buried under lists, comparisons, and flashy dashboards. Everyone is looking for a magic bullet: a ready-made template, a single tool, or a dashboard that will instantly tell them how their product stacks up.
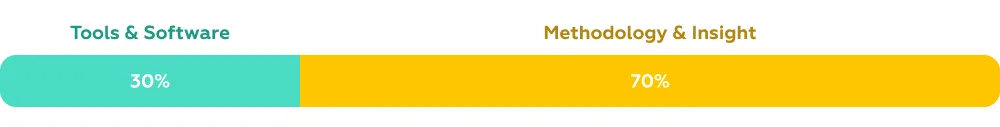
At Markswebb, we know the reality is more nuanced. Tools are essential — they give structure, automate repetitive tasks, and help visualize patterns — but they account for only 30% of effective benchmarking. The rest comes from strategy, context, and the ability to interpret insights across multiple dimensions: user behavior, interface design, feature parity, and performance benchmarks.
In this guide, we’ll walk you through a comprehensive UX competitive benchmarking toolkit, showing not just what tools exist, but how to combine them into a methodology that works for products of any scale — from startups testing their first MVP to established platforms managing complex ecosystems. By the end, you’ll see that the right mix of tools, frameworks, and expertise is what transforms raw data into actionable product insights.
Contents
Effective competitive benchmarking doesn’t start with opening a tool or building a comparison table — it begins with clarity of purpose. But once that purpose is defined, the next critical step is choosing tools that actually support your specific use case.
The challenge is that most UX teams don’t lack tools — they lack alignment between tasks and tools. Without it, even the best software turns into “busy work”: dashboards without decisions, recordings without conclusions, and frameworks without outcomes.
The first step is still setting your goals: what business or UX question are you trying to answer? Are you trying to reduce onboarding friction? Improve task success rates? Match a competitor’s key flows? The difference now is that each goal should immediately map to a specific type of tool and method. How to choose the right tool for your benchmarking task
Instead of thinking in categories of tools, it’s more effective to think in use cases:
This approach turns tool selection into a practical decision-making process, rather than a search for the “best” platform.
A structured benchmarking process still underpins everything, but now each step is directly tied to tools that support it:
This way, tools are no longer the starting point — they become targeted instruments within a larger system. When chosen based on specific task, they stop being fragmented solutions and start working together as a cohesive benchmarking toolkit.
Choosing the right tool depends on what you need to measure and achieve. One of the biggest misconceptions is that there are “pure” benchmarking tools that solve everything. In reality, most teams combine specialized benchmarking methods with general-purpose UX and analytics software.
To make this clearer, it helps to separate tools into two groups:
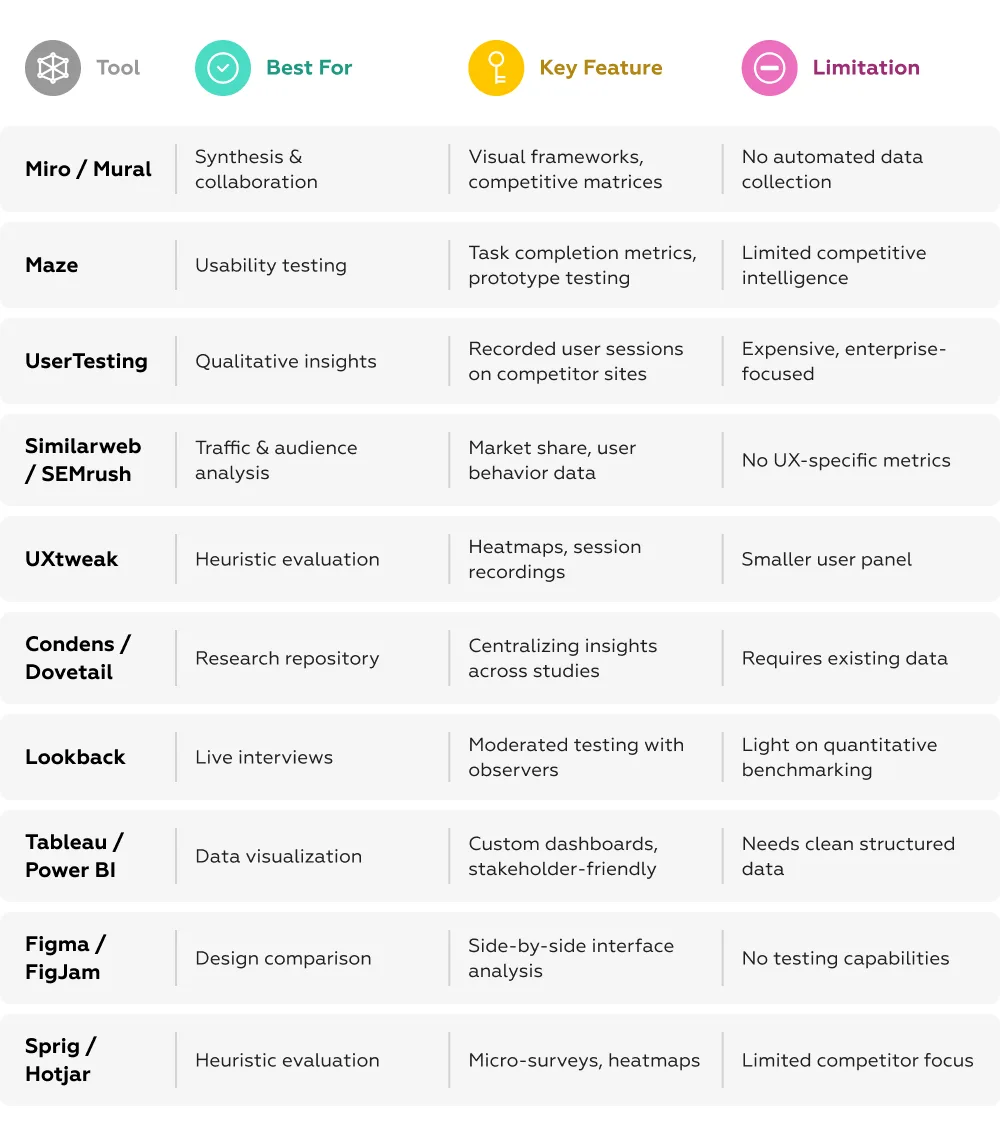
These tools are best suited for measuring UX performance across scenarios, even if they are not full benchmarking platforms by themselves:
These tools answer the question: “How well does this experience perform?”
These tools are not built specifically for benchmarking, but become essential when integrated into the process:
These tools answer the question: “How do we structure, interpret, and communicate findings?”
Instead of searching for a single “benchmarking platform,” it’s more effective to map tools to конкретные задачи:
When mapped to a Customer Journey Map (CJM), tools naturally align with each stage:

This approach makes one thing clear: there is no single “benchmarking tool.” Instead, benchmarking emerges from a system of tools, each solving a specific part of the problem — from data collection to insight delivery.
It’s tempting to believe that loading a product into a tool or assembling a competitive matrix will automatically reveal insights. The reality is more nuanced: tools can capture data, but they can’t interpret it for you. Here’s what’s missing when you rely solely on software:
This is where the conversation shifts from software to expertise. The right toolkit only gets you part of the way; turning data into actionable UX improvements requires strategic thinking, methodological discipline, and experience in interpreting patterns across competitors.
Competitive benchmarking is often framed as a tooling problem — which platform to use, which dashboard to build. In reality, it’s a research discipline. Tools support the process, but the value comes from how systematically and consistently the research is designed and executed.
A robust benchmarking approach typically includes several core elements:
At this stage, software becomes a supporting layer — particularly when combined with a structured scoring model. Many teams rely on binary or standardized evaluation systems (e.g., criteria met / not met, or graded scales) to break down complex user experiences into comparable units. This approach makes it possible to aggregate results, visualize patterns, and process findings efficiently using analytics and visualization tools.
But even the most advanced tooling depends on the integrity of the research design behind it. Without a clear framework, scoring systems become arbitrary, and dashboards turn into decoration rather than decision-making instruments.
This is precisely what Markswebb has been doing for over a decade — turning benchmarking into a repeatable, rigorous process that delivers measurable business impact.
Even with the best stack of tools, teams often hit the same wall: how exactly should we compare products? Which scenarios matter? What counts as “good” UX? Without clear criteria, Miro becomes just a board full of sticky notes, and UserTesting turns into a collection of disconnected videos rather than a source of structured insight.
This is where a research-driven framework changes everything. At Markswebb, we approach benchmarking by breaking down user experience into hundreds of simple, binary criteria — each one answering a clear question: yes or no.
Instead of debating opinions, teams evaluate products against structured, scenario-based checklists. The result is a system that transforms subjective impressions into measurable, comparable data.
This binary structure is what allows benchmarking tools to operate at their full potential:
Instead of fragmented notes, you get a structured dataset where it’s clear not just what underperforms, but exactly where and why your product falls behind competitors.
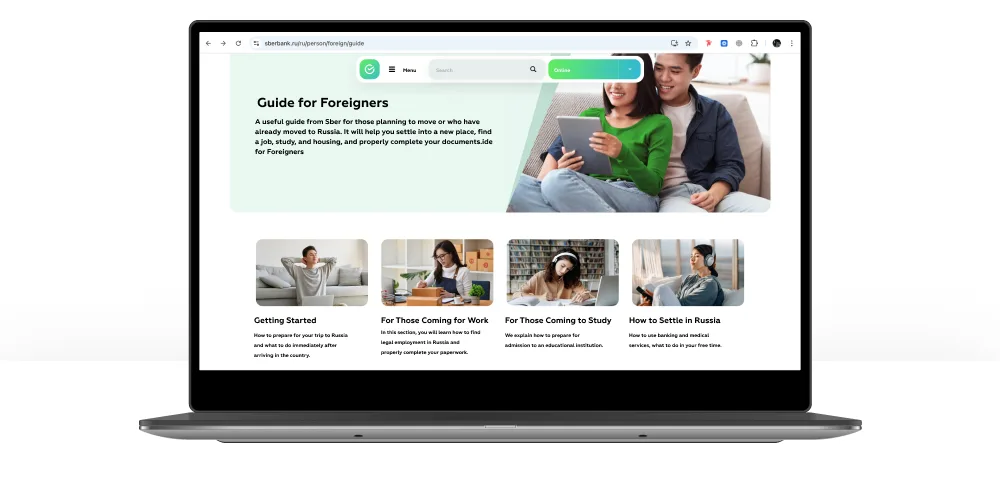
This approach is not theoretical — it has been applied in large-scale benchmarking studies, including Markswebb’s research on migrant banking in Eastern Europe. Banks were evaluated across key scenarios such as onboarding, transfers, and daily account management.
Using a binary evaluation system, each step of the journey was translated into clear, measurable criteria. This made it possible to uncover not just general usability issues, but precise gaps — from missing onboarding guidance to unclear transfer conditions and limited support access.
For one bank, these insights led to a prioritized roadmap instead of generic recommendations. As a result, they were able to:
Most importantly, the benchmark showed not just what to fix, but where the product stood vs competitors and what would drive the highest impact.
The research revealed consistent UX patterns: over ten recurring problem areas and 30+ best practices improving accessibility for migrant users.
The main challenge was ambiguity — users struggled to understand available products, required documents, and how key operations (like transfers or limits) actually work. The most effective solutions focused on clarity and guided navigation.

For example, some banks introduced dedicated entry points for migrant scenarios, making key functions easier to find. Others created structured information hubs, grouping services by user goals (e.g., working abroad, managing money, sending transfers). This reduces cognitive load and helps users quickly identify relevant actions.
These patterns show that benchmarking doesn’t just identify issues — it reveals proven solutions that can be directly applied.
By combining a binary model with the right tools, benchmarking becomes a competitive intelligence system.
The focus shifts from “Which tool should we use?” to strategic questions:
This is the difference between collecting data and driving product decisions.
UX benchmarking tools are powerful — but on their own, they remain disconnected pieces of the puzzle. Dashboards, recordings, heatmaps, and matrices can generate a large volume of data, but without a unifying logic, they fail to form a coherent picture or provide confidence in decision-making.
What bridges this gap is methodology. The Markswebb binary evaluation system acts as that missing layer — structuring data, aligning it with real user scenarios, and turning scattered observations into clear, comparable, and actionable insights.
If your goal is not just to collect competitor screenshots, but to build an objective, prioritized product roadmap grounded in market reality, then the choice of methodology — and the expertise behind it — matters more than the choice of software.
Markswebb helps companies build this process end-to-end: from defining the framework to embedding it into product decision-making. It’s about more than using tools — it’s about working with a partner who knows how to make those tools deliver real business impact.
If you want to evaluate your bank onboarding UX, identify friction points, and benchmark against competitors — reach out to us on WhatsApp or send us an email, and we’ll help you define the right approach.
We respond to all messages as soon as possible.
We’ve evolved dozens of successful financial services and are eager to prove that our expertise can be implemented in other industries and around the world. Have a look at our success stories!